Enabling Tracing for Harness Leveraging OpenTelemetry
Enable Tracing in Harness Services
The following Harness services(Platform, CD, CI, IACM, SSCA) support OpenTelemetry tracing:
- access-control, harness-manager, ng-manager, platform-service, pipeline-service, ci-manager, sto-manager, cv-nextgen, iacm-manager, audit-event-streaming, debezium-service, template-service, idp-service, ssca-manager.
Common Global Configuration
global:
  monitoring:
    otel:
      enabled: true
      collectorEndpoint: http://opentelemetry-collector.otel.svc.cluster.local:4317/
Overview of Tracing Architecture
The tracing setup for Harness leverages OpenTelemetry to capture distributed traces across services, enabling deeper observability and troubleshooting.
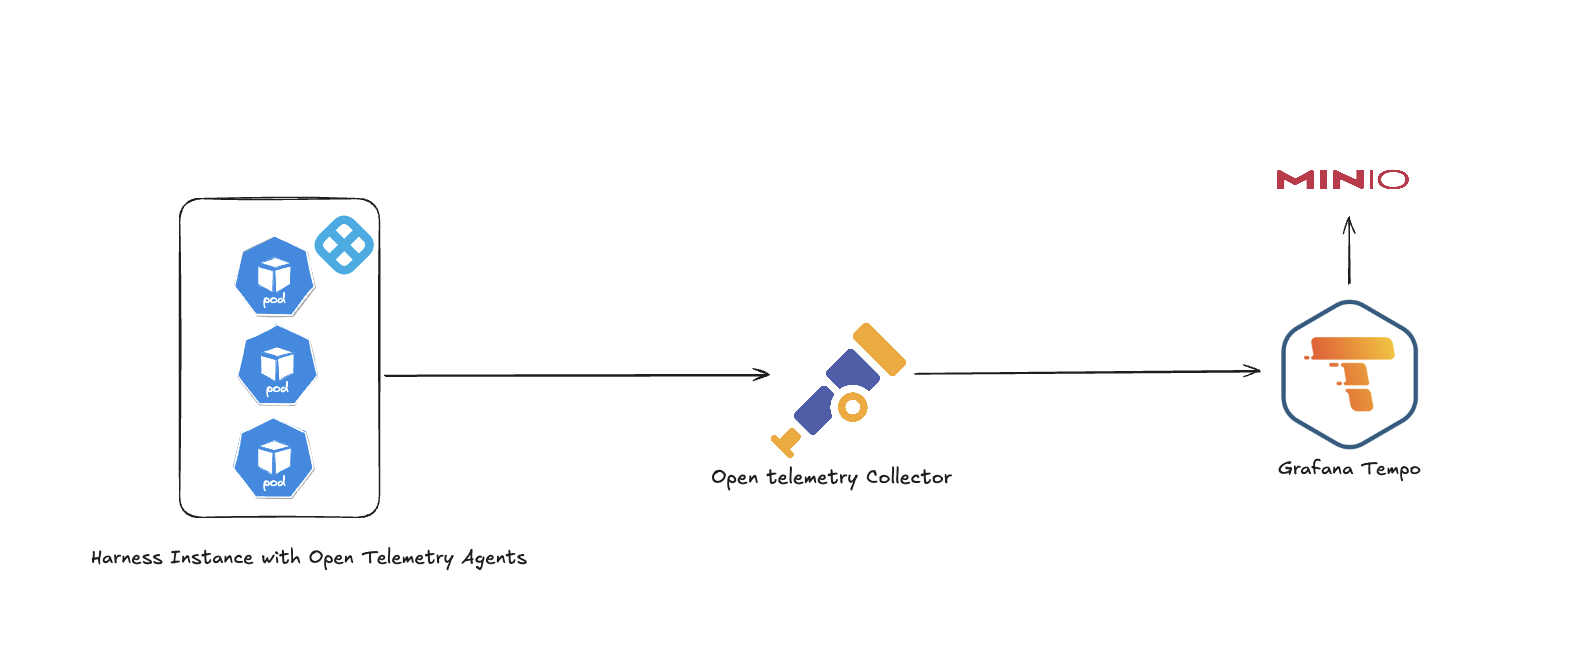
The architecture follows this flow:
-
Harness Instance with OpenTelemetry Agents: Each service in the Harness cluster is instrumented with OpenTelemetry agents to generate trace data.
-
OpenTelemetry Collector: Trace data is sent to the collector, which processes, batches, and exports it to supported backends.
-
Grafana Tempo: The collector forwards the traces to Grafana Tempo, a high-scale distributed tracing backend.
-
MinIO: Tempo stores the trace data in an object store, such as MinIO, for durability and querying.
Install Grafana Tempo (Optional)
Grafana Tempo is used to store and query trace data collected via OTel.
Step 1: Install MinIO for Trace Storage (Optional)
-
Create a file named
minio.yaml:fullnameOverride: "minio"
mode: standalone
provisioning:
enabled: true
buckets:
- name: tempo
region: us-east-1
lifecycle:
- id: 7dRetention
expiry:
days: 7
nonconcurrentDays: 3
tags:
owner: tempo
persistence:
size: 20Gi
auth:
rootUser: admin
rootPassword: "admin123" -
Install MinIO:
helm repo add bitnami https://charts.bitnami.com/bitnami
helm install minio bitnami/minio -f minio.yaml -n tempo --create-namespace
Step 2: Install Tempo Distributed
-
Create a file
tempo.yamlwith appropriate overrides. -
Install Tempo:
helm repo add grafana https://grafana.github.io/helm-charts
helm install tempo-distributed grafana/tempo-distributed -f tempo.yaml -n tempo
Configure Grafana with Tempo as Trace Datasource
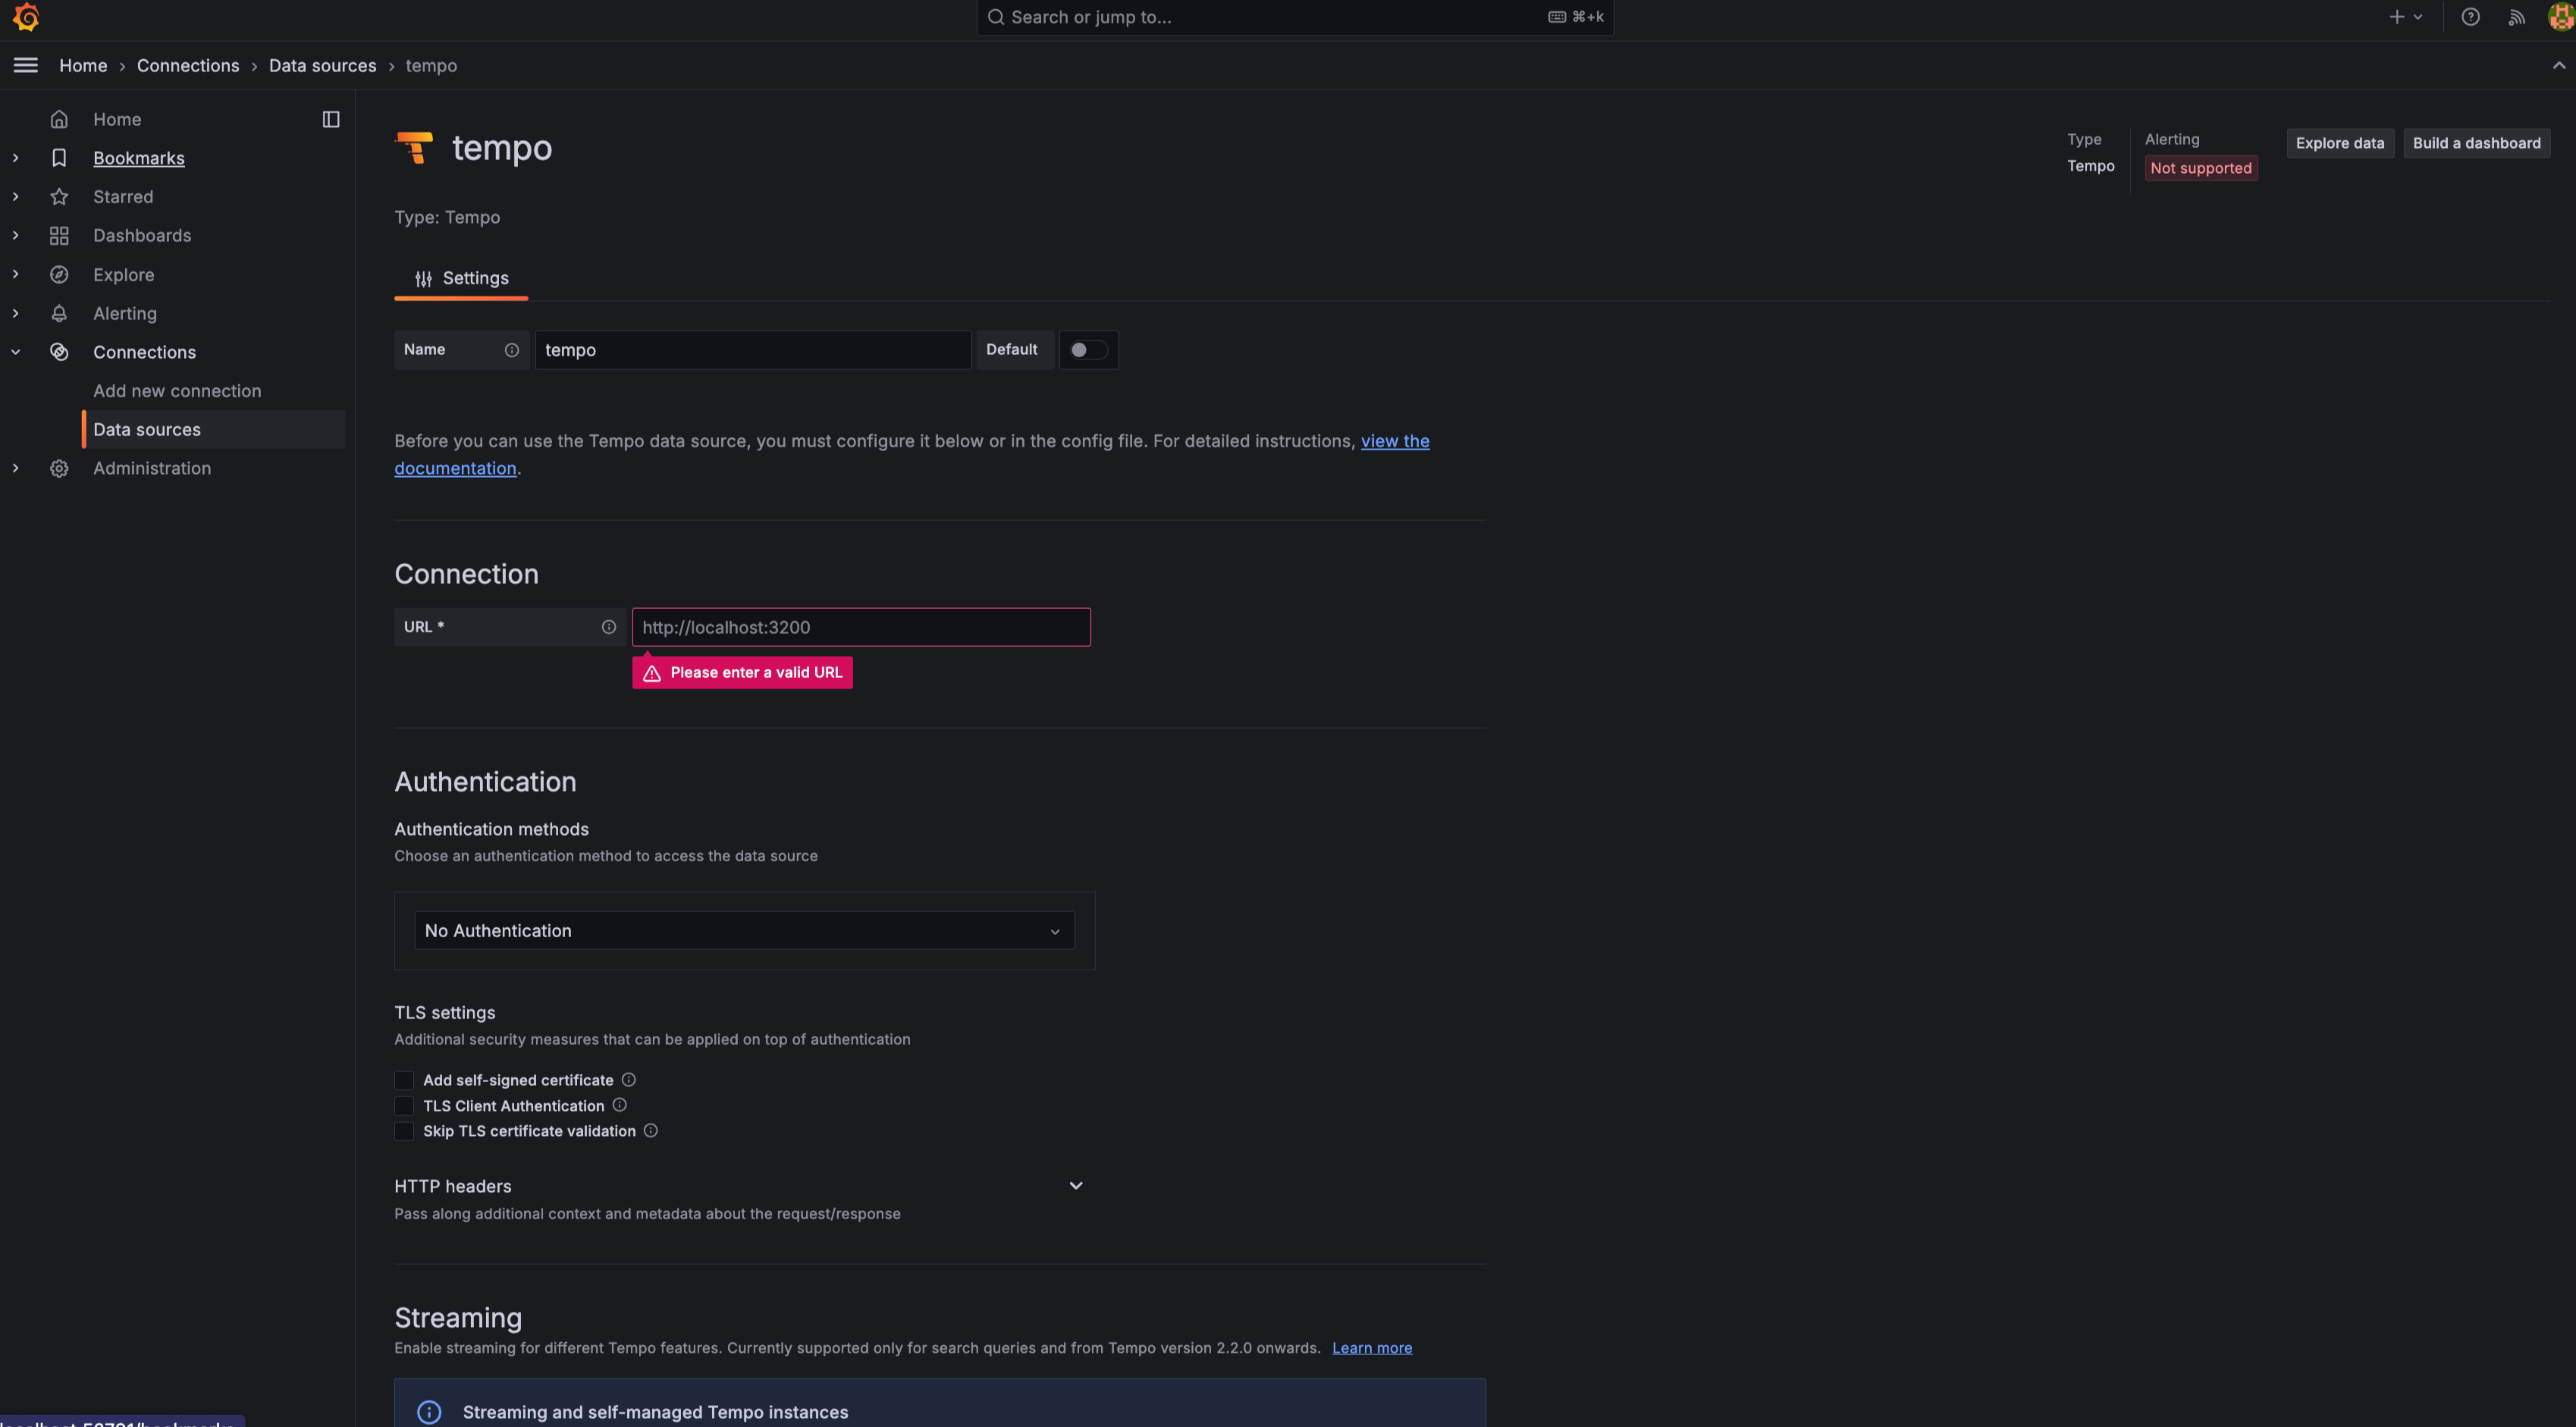
In Grafana:
-
Go to Settings > Data Sources
-
Add a new Tempo data source
-
If everything is deployed in the same namespace, set the URL as:
http://tempo-distributed-gateway.tempo.svc.cluster.local:80/
Install OpenTelemetry Collector (Optional)
This step allows fine-grained control over trace ingestion, processing, and exporting.
Step 1: Create a Collector Override
Create a file otel-collector.yaml and define the receivers, exporters, and pipelines.
Step 2: Install Collector
  helm repo add open-telemetry https://open-telemetry.github.io/opentelemetry-helm-charts
  helm install opentelemetry-collector open-telemetry/opentelemetry-collector -f otel-collector.yaml -n otel --create-namespace
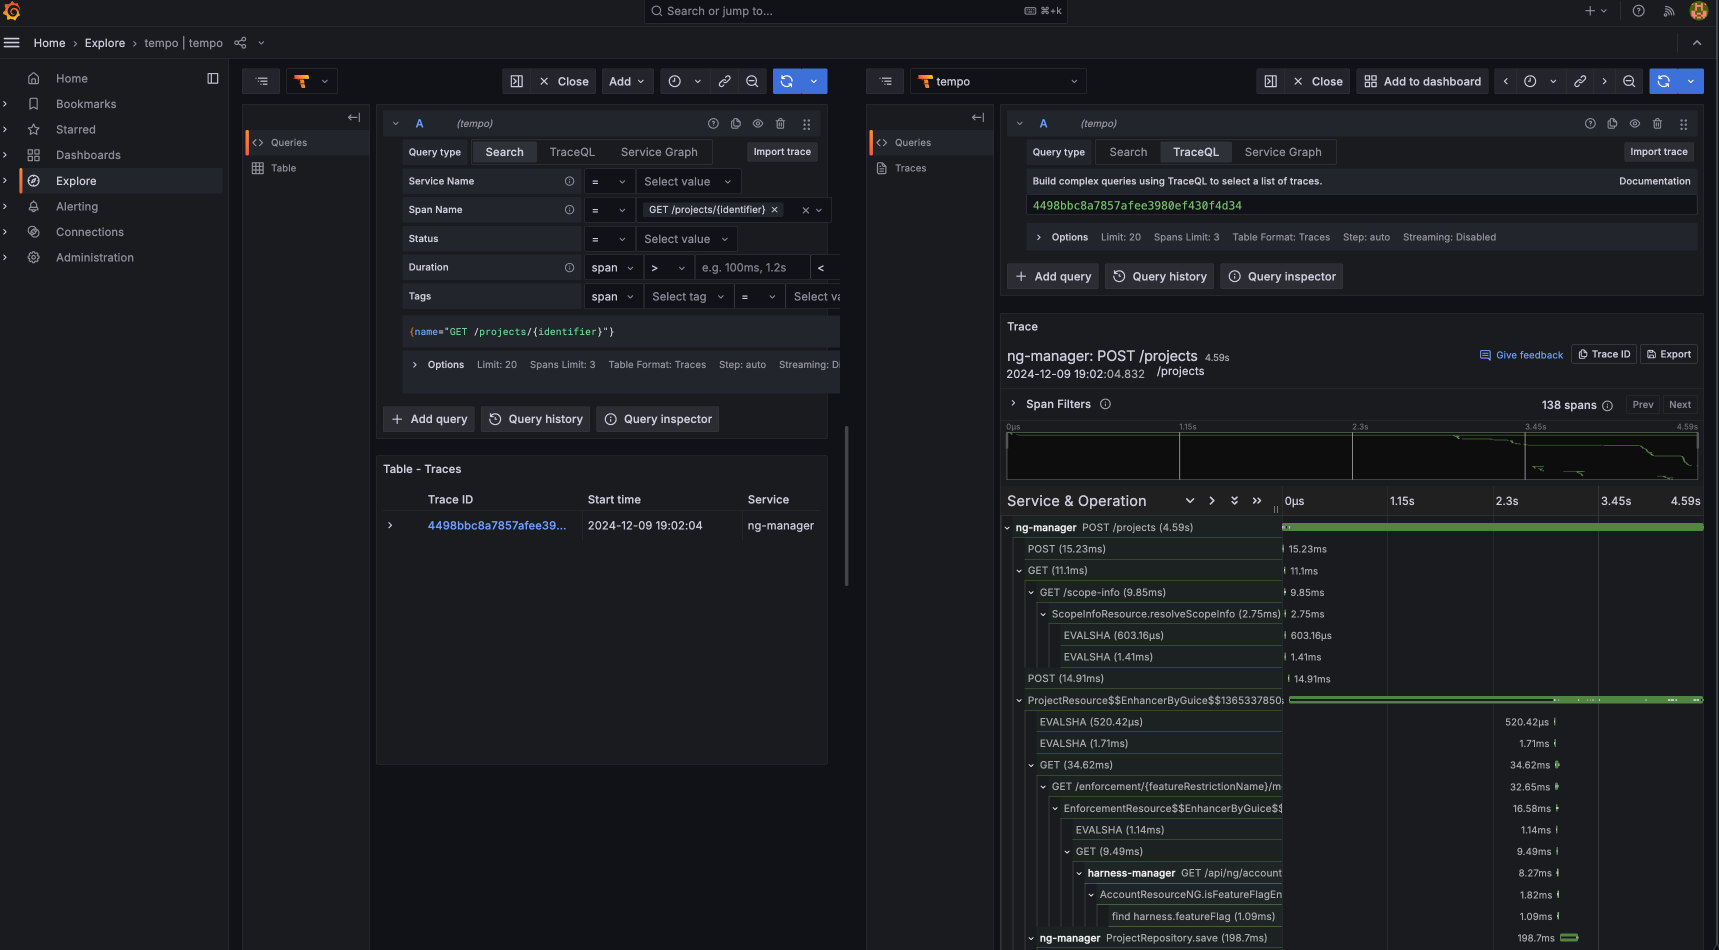
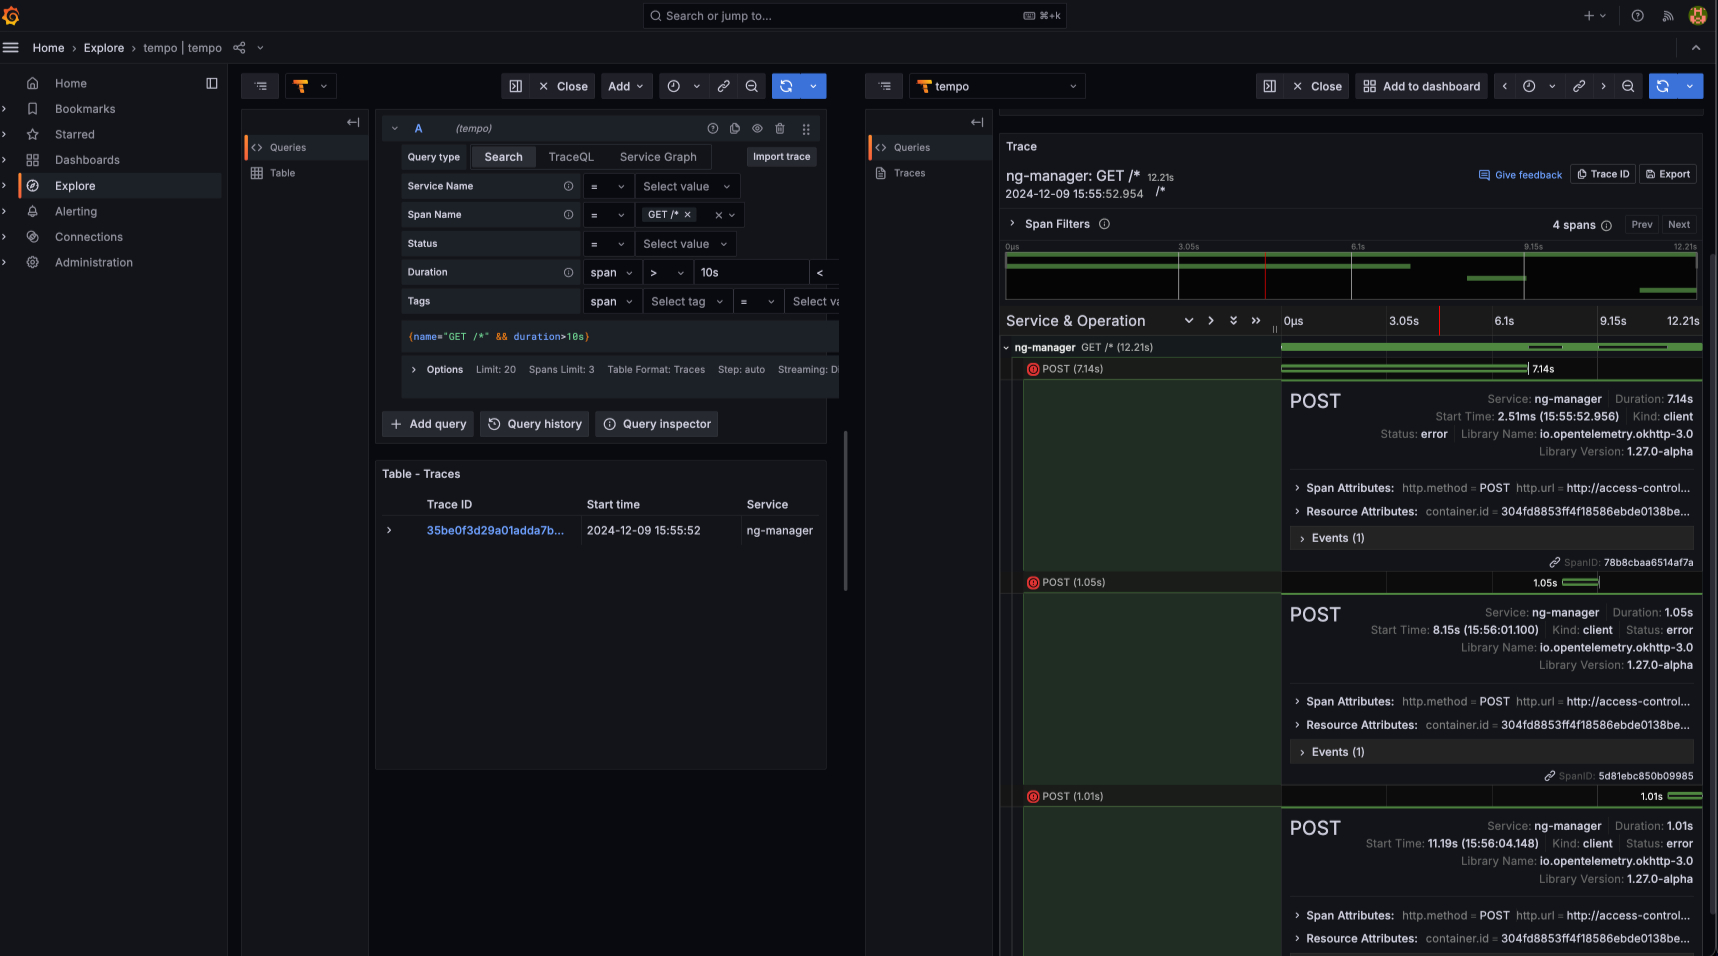
Visualize Traces in Grafana
Once traces flow from Harness services through the OTel Collector and are stored in Tempo, you can use the Traces tab in Grafana to:
- Query traces by service name
- Explore duration, calls, and trace sizes
- Debug performance bottlenecks and error spikes
Summary
This setup provides end-to-end distributed tracing visibility into Harness using:
- OpenTelemetry for instrumentation
- Tempo for trace storage and query
- Grafana for visualization
With minimal effort, you now gain deep insight into request flows across services, aiding performance debugging and reliability engineering.